The Maturity Model for Network & Infrastructure Management
SevOne provides the world’s largest CSPs, MSPs and Enterprises with the most comprehensive technology portfolio to collect, analyze and visualize network & infrastructure performance data to deliver actionable insights to compete and win in the connected world.
SEVONE NMS CLUSTER
PROVEN SCALABILITY FOR THE WORLD’S LARGEST NETWORKS
SevOne NMS Cluster™ has the proven scale to meet the data extraction and data enrichment needs of the world’s largest networks, transforming raw data into actionable, real-time insights to meet the agility, reliability and business efficiency needs of large enterprises, CSPs and MSPs.
SevOne NMS Cluster extracts the broad range of metric, flow, log, experience and meta data from all layers of virtual and physical networks and infrastructure. Leveraging a growing set of data enrichment techniques including automated baselining, anomaly detection and topology awareness, NMS Cluster helps reduce service delivery risk through integrated alerting and reporting.

EXTRACT
Extract billions of data points a day you need from across your multivendor network and infrastructure— including metric, flow, log, experience and/or meta data
ENRICH
Automated enrichment of your data including baselining, trending, topology awareness, alerting, reporting and more
STORE
Store raw data and enrich it for reporting purposes while making it available to external business systems and/or SevOne Data Insight
WHY SEVONE NMS CLUSTER FOR METRICS?
The SevOne NMS Cluster is today’s fastest, most scalable and most comprehensive metric data collection, monitoring, reporting and analysis solution. NMS Cluster supports the extraction, enrichment and storage of billions of data points a day from across the largest multi-vendor enterprise,CSP, and MSP networks and infrastructure.
Be Software-Defined Ready
Real-time collection and topology awareness for: Cisco ACI, OpenStack, VMware vCenter, Mesos, Docker and Kubernetes
Easily Monitor SLAs
Guarantee availability and improve customer satisfaction
Get Real-time and Historical Reports
Ensure customer and end-user success and transparency, with visibility across the business
Monitor Any Device
Leverage a library of thousands of different device types. View the entire infrastructure, including network, compute, storage, power and cooling. Analyze data from anything with a time-stamp
“Out of the Box” Support
Automatically integrate metrics from thousands of different devices and technologies with built-in support for extracting metrics using a variety of methods including: DNS, HTTP, ICMP, IP SLA, ACI, VMware, JMX, NBAR, Proxy Ping, SNMP, WMI and more
Not Supported “Out of the Box”? SevOne Can Help
Retrieve or import any data that can be made available in a flat file format. NMS Cluster has the ability to programmatically parse CSV, XML, JSON and other file types through the creation of SevOne xStats Adapters. Adapters are available across a wide range of vendor and device types, including Accedian, Cisco STAR OS, Nokia SAM, Nokia NetAct, Ericsson OSS RC, Arista EOS, IMPI, OpenStack Assurance, OpenStack Performance and many more
Enable REST-based API Platform Automation
Automate platform operations actions such as the creation, deletion and updating of objects, devices, sources, metadata, alerts, policies, groups, reports and maps
Make the Most of Your Resources
Optimize the economics of the business today (e.g. datacenter power/cooling analysis, server and CPU/workload utilization)
Plan for Capacity
Confidently plan for needs like WAN links, CPU utilization and power usage
Baseline at Scale
Automatically baseline every data metric you collect and get alerts when real-time performance deviates from historical norms
Get Answers in Seconds
Consolidate disparate tools into a single platform and dashboard
Plan for Maintenance Windows
Proactively create, view, edit and delete device level maintenance windows via UI or REST API
WHY SEVONE NMS CLUSTER FOR FLOWS?
With real-time flow analysis, the SevOne NMS Cluster helps you pinpoint potential problems on the spot. NMS Cluster not only allows you to quickly and easily spot bandwidth hogs and wasteful traffic; it also gives you insight into how specific applications are using your network. This information is critical when it comes to prioritizing traffic and creating policies that help eliminate waste.
Identify Rogue Applications
- View and customize lists of recognized applications attained through port-based identification
- Use “Type of Service” (ToS) Filters to identify the traffic running on your network, non-approved applications consuming bandwidth, and the impact on your Quality of Service (QoS) policies
Pinpoint Top Talkers
Quickly identify what type of traffic contributed to a spike, resolve DNS issues and check the “Next Hop” using the SevOne Top Talkers report
Gain Immediate Access to Historical Data
Store up to seven days of raw flow data and one year of aggregated flow data at one-minute intervals for each report template and interface
Troubleshoot DNS Storms
Troubleshoot low bandwidth and high impact events like DNS storms
Detect Micro Spikes
Use one-second visibility of raw data to see small bursts of traffic that other tools miss
Flow Alerting and Enhancements
Create policies and thresholds and generate alerts based on flow data
Broad and Scalable Flow Support
- Avoid being limited to predetermined fields or templates, with the ability to monitor NetFlow v5/v9, Flexible NetFlow, Citrix AppFlow, Cisco NAM, Cisco Medianet, Cisco AVC, NBAR/ NBAR2, IPFIX Object Template support, NetFlow variable length support, sFlow, NetStream, Juniper J-Flow, and 200+ other available fields of NetFlow
- Collect up to 12 million flows per minute, and grow data collection infinitely as part of the distributed SevOne NMS Cluster architecture
WHY SEVONE NMS CLUSTER FOR LOGS?
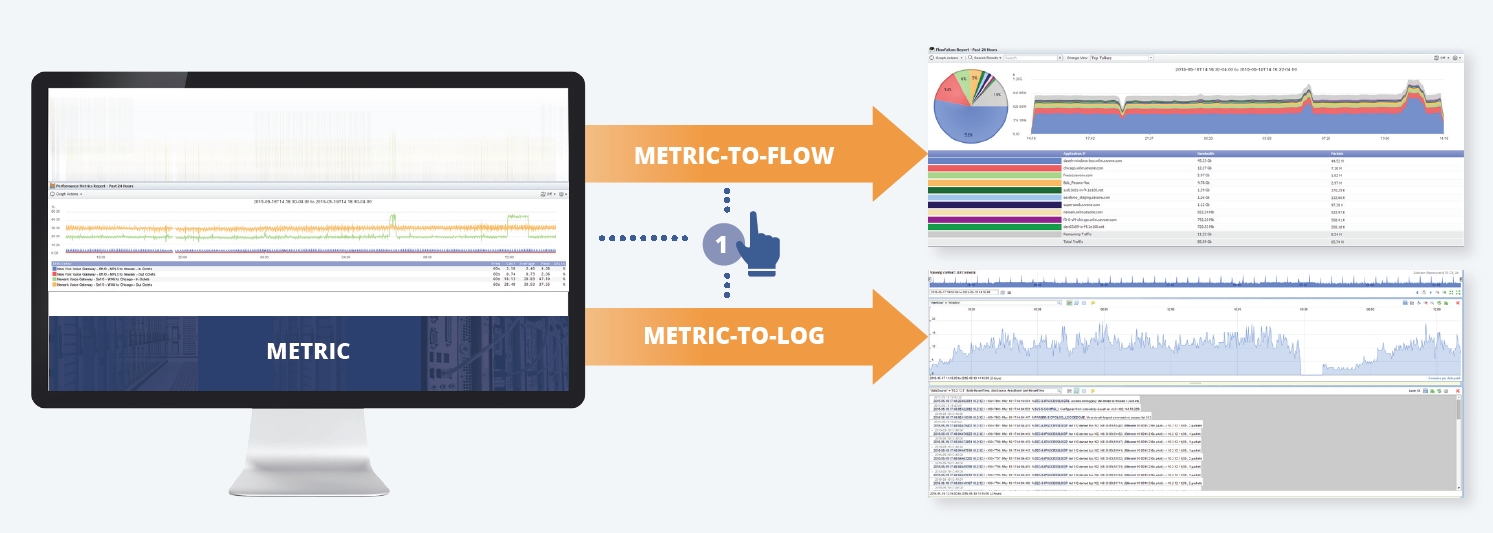
With the SevOne NMS Cluster, you can move beyond traditional log search, into real-time troubleshooting of log data at scale. That’s because the NMS Cluster can extract terabytes of log data daily and correlates it to performance events, thereby eliminating the need for search in your process. It also increases application performance visibility by providing single-click drill-down from related data— SNMP metrics to NetFlow records to syslog files, for example.
Automated Log Analytics
- Automatically correlate real-time performance metrics with log data
- Improve visibility of the root cause of performance degradation
- Receive proactive alerts of customer and end-user behavioral trends
- Get targeted and intelligent anomaly detection using multiple log metrics across many devices in real-time
- Leverage multi-variable alerting of log data to identify issues and trends
Integrated Troubleshooting
- Integrated Decrease time-to-troubleshoot with integrated metrics, flow and logs
- Eliminate timely error code analysis with fully configurable value-based lookups
- Gain a greater understanding of how configuration changes impact application performance
Customize Your Log Analytics
- SevOne 10-Day Certification – Work directly with SevOne Support to have new and updated logs supported by your implementation
- Do It Yourself – Utilize the SevOne Application Key Builder on Connect.SevOne.com to customize your log monitoring and analysis
- Download Now – Download from sets of existing Log Application Keys, supporting log types from across the industry, including syslog, statsD, Tomcat Perflogs, Apache logs, Unix Error/ Cron logs, Cisco, Juniper, F5, Microsoft, and more on Connect.SevOne.com
WHY SEVONE NMS CLUSTER FOR USER EXPERIENCE DATA?
Software, applications and services running on the network infrastructure are the lifeblood of every carrier and large enterprise. And, the ability to detect and rapidly resolve problems with these applications and services can mean the difference of millions of users, dollars in revenue, or hours in productivity. As a result, being able to understand how well end users are experiencing a service or application has become a business critical requirement—whether it’s hosted on premises, across a WAN infrastructure, in a hybrid cloud or delivered by a provider.
By integrating the SevOne NMS Cluster with SevOne User Experience, a resell of AppNeta Performance Manager, users can actively test entire network paths by using synthetic traffic and collect in-depth end-user experience data across enterprise, cloud and communication service provider infrastructures. Now you can easily measure actual application and service performance and directly correlate it to the network and digital infrastructure that’s responsible for delivering it. Whether you’re looking to measure over Wi-Fi access points to local or remote servers, over the mobile infrastructure, over VPN to remote offices, or over the Internet to Web applications and into cloud services, SevOne User Experience allows you to gather and integrate user experience with other metric, flow and log data as part of your SevOne NMS Cluster deployment.
Monitor Any Network Without Impacting Production Applications
Get insight into any network, even cloud providers’, by sending and receiving precisely timed network traffic, so you can assess performance in real time. Always-on monitoring gives one-minute granularity on latency, data loss and jitter, stored for up to a year, while providing insight into actual versus provisioned capacity.
Correlate Application and Network Performance
With application-based SLAs, SevOne User Experience automatically knows when network performance blips are just blips, and when they’re affecting your end users. A continuous stream of performance insight is compared against your application specific SLAs, so you know exactly when and how network performance impacts application performance.
Find and Fix Problems Fast on Any Digital Infrastructure
Troubleshooting application response issues often require network, system and infrastructure teams to work together. With SevOne User Experience, multiple teams can actively test, troubleshoot and pinpoint issues across the entire path applications take, including user, network, server, databases and more. With an optional software license, you can enable up to 10Gbps deep packet inspection for further details on application traffic. With SevOne User Experience, you can gain valuable insight, and drive cross team collaboration that can reduce mean time to resolution opposed to time to innocence.
Measure Critical SaaS solutions: Salesforce, Office 365, Google Apps and More
Measure performance, functionality and availability directly from the end user’s perspective, using a real web browser. Get started in minutes with our Quick Start Workflows for Salesforce, Office 365, Google Apps and more. Quick Start Workflows are especially helpful because they enable you to monitor apps from the end user, through the network, to the app provider.
Support Custom Applications
Create custom workflows and string together up to 20 commands, execute them back to back, measure the result, and get performance alerts. You can also replay workflows from a consistent environment to highlight any change in application performance.
Every Detail, Every Important Transaction
Get every detail of important transactions in your web app, and break down the source of all latency by browser, application or network. The appliance also enables you to pinpoint when problems started, with full waterfall charts for every transaction in the last 30 days. Finally, you can and identify larger trends with up to a year of historical data.
Deploy Anywhere Users Are, Inside and Outside the Firewall
The best place to measure user experience of web applications is from your end users’ locations. Using the appliance you can combine usage from multiple monitors to identify trends across different locations and isolate all kinds of problems—from global slowness to congestion at a single office.
Leverage Your TWAMP-enabled Infrastructure
Measure the round trip performance from any two points in your TWAMP-enabled IP infrastructure with built in support for the Two Way Active Measurement Protocol (TWAMP).
WHAT KIND OF DATA IS SUPPORTED?
| Data Collection Type | Protocols and APIs Supported |
|---|---|
| Polling Technologies | SNMP v1-v3, ICMP, DNS, HTTP, NBAR, QoS |
| Flow Collection | NetFlow versions 5-9, IPFIX, sFLow, J-Flow, Citrix AppFlow |
| Response Time | IP SLA, ICMP, TCP Port Response, HTTP, and URL |
| Servers and Applications | SNMP, WMI, JMX, vSphere API, and Process Polling |
| 3rd Party Data | SOAP API, xStats |
| Log Data | Syslog, statsD. Tomcat Perflogs, Apache logs, Unix Error/Cron logs, Cisco, Juniper, F5, Microsoft & more |
| User Experience Data | Packet Loss, Latency, Round Trip Time, QoS, Number of Hops, Available and Utilized Capacity,Data and Voice Loss, Data and Voice Jitter, MOS, Total Time (Network, Server, Browser) |
SevOne Data Insight
SevOne Data Insight transforms physical and virtual operations management environments through customizable visualizations and flexible, shareable workflows that deliver the right insight to the right person, at the right time.
Create Customizable Visualizations and Workflows
Visualize
Easily create reports and customized workflows between reports to meet your business needs
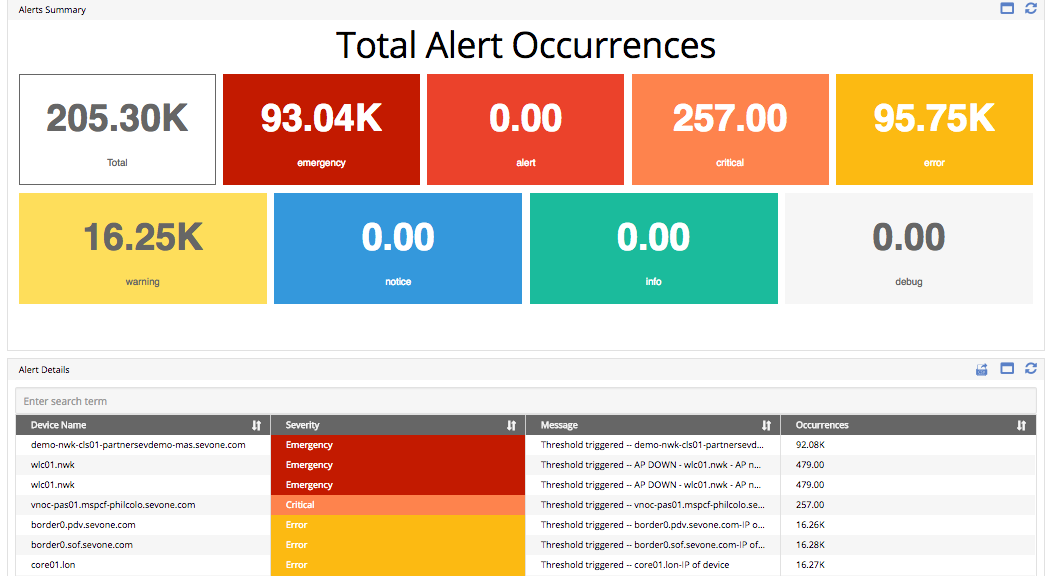
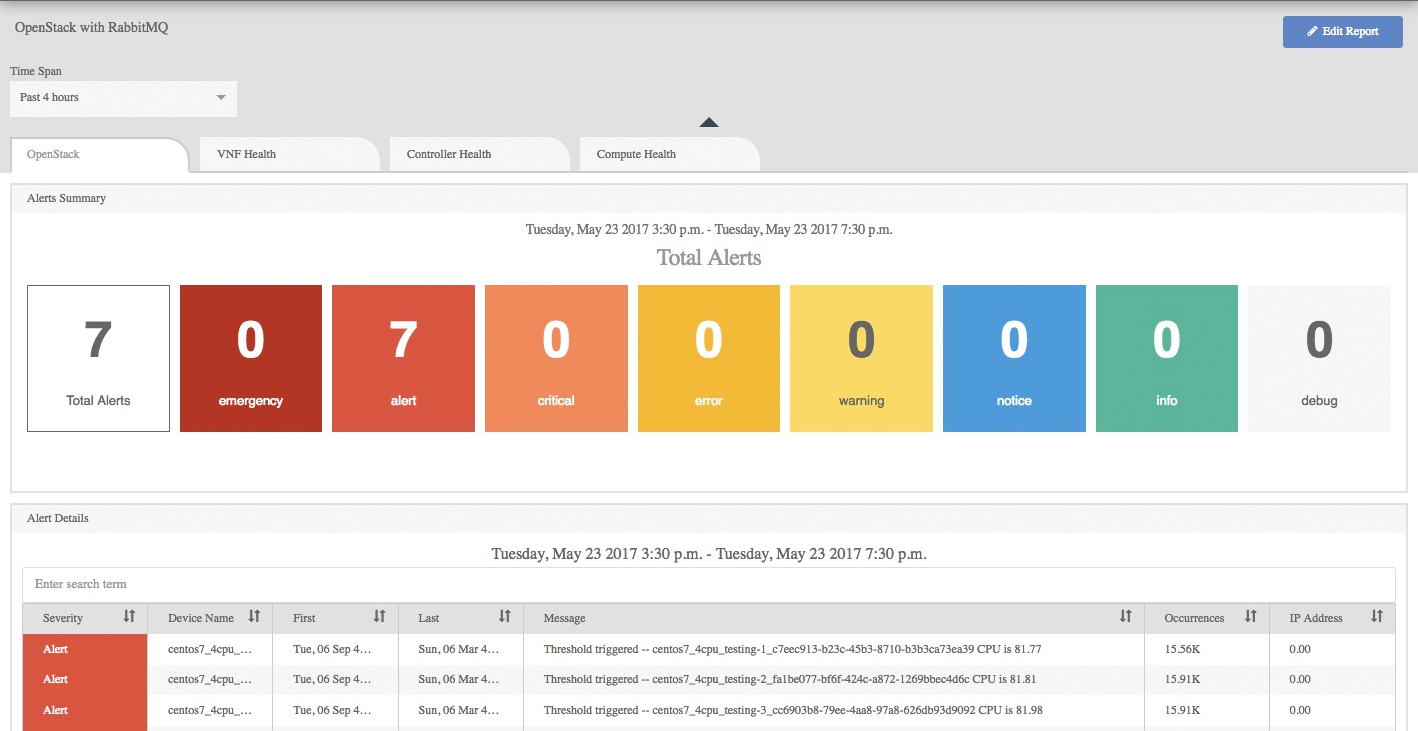
SevOne Data Insight delivers widgets—individual visualization templates embedded with deep knowledge of SevOne data structures— intended to be highly configurable by operations, engineering and line of business users for consumption in a report or linked as part of a customized workflow.

Collaborate
Open up access to the real-time insights of the SevOne Data Platform by an entire new set of users.
Share reports and workflows for collaborative insight with peers and business leaders.
Unify
Remove barriers between datasets by quickly creating new widgets to integrate data from 3rd party sources
Extend the value of SevOne Data Insight by creating new reusable widgets for rapid, customized visualization of any network and infrastructure application or 3rd party data with the Data Insight WDK

Insights at Your Fingertips
Data collection is complicated. Getting insights from data shouldn’t be.
Any User
Easily customize views for any user in the organization—from operations and engineering teams to line of business owners
Any Data
Enable customers, partners, and community to visualize and create customized workflows between SevOne and 3rd Party data
Flexible Reports
Leverage smart filters to build flexible reports that drive efficiency—collapse hundreds of reports into one
Flexible Workflows
Create business specific workflows through shareable interactive content